
July 5, 2013: The Toronto Maple Leafs sign David Clarkson to a 7 year, $36,750,000 contract.
November 2013: Dave Nonis comments that “people run with these [advanced hockey] stats like they’re something we should pay attention to and make decisions on, and as of right now, very few of them are worth anything to us.”
If Nonis had “paid attention” to even the most rudimentary advanced stats, he would have recognized that signing Clarkson to that kind of contract was cosmically stupid.
I’m not talking 20/20 hindsight here. I’m talking about straightforward statistical analysis which -- even before Clarkson’s disastrous first season -- had more red flags waving than a North Korean military parade.
Let’s go back in time to those heady days before the Leafs transmuted over 8% of their cap space into kindling.
It’s July 2013. The Leafs are considering giving David Clarkson a contract on par with the likes of John Tavares, Marian Hossa, James Neal, Jamie Benn, and Joffrey Lupul. Read that list one more time and let it sink in.
Dave Nonis apparently thinks to himself “Alright! This is a great idea!”
Clarkson had just come off his best 2 seasons ever. In 2011-12 he had 46 points (30 goals, 16 assists) in 80 games, and in the abbreviated 2012-13 season he had 24 points (15 goals, 9 assists) in 48 games. Not horrible numbers, but he wasn’t exactly setting the league on fire.
Now let’s dig deeper.
Clarkson’s best year’s numbers (2011-12) don’t come close to earning the money the Leafs gave him. In 5-on-5 situations Clarkson’s 1.53 points per 60 minutes was good for only 143rd in the NHL, right next to the likes of Kyle Brodziak (whose cap hit is 54% of Clarkson’s) Steve Ott (56%), and Ben Eager (23%).
If you look at 2011-12 and 2012-13 combined then things get considerably worse. Clarkson falls to #219 in 5v5 points per 60.
But beyond that, Nonis should’ve been seriously skeptical that Clarkson could repeat even that pedestrian performance for at least three reasons.
First, in 2011-12 Clarkson’s shooting percentage was 13.2% and his “true” shooting percentage (discussed in our March 20 column) was 8.5%, both of which were much higher than his lifetime averages of 9.3% and 5.9% respectively. It’s exceptionally rare for a player who has been in the league for 4 years to significantly increase his shooting percentage on a sustained basis. At his historic averages, in 2011-12 Clarkson would have scored only 21 goals, not 30.
Second, Clarkson just turned 30, which is right around the time forwards’ production starts dropping precipitously. According to advanced stats guru Eric Tulsky, production can be expected to drop to 80% of a player’s peak at age 31, 70% at age 32-33, and 60% by age 35. So by the second year of the contract the Leafs should have expected Clarkson to generate around 30 points. By year 6 of the monstrosity, it’d be closer to 22 points.
Third, Clarkson scored a boatload of his points in 2011-12 on the power play. This year he’s played just 20% of Toronto’s PP minutes. This obviously would further impact his productivity.
Which leaves us with Clarkson’s “intangibles,” chief among them his physical play.
But guess what? That aspect of his game tends to be overstated. In 2012-13 his hit differential was actually -2.2 per 60 minutes (if you want to know why that matters, see last week’s column). Maybe he gets credit for being the “hittee” rather than the “hitter,” but I wouldn’t think so.
Finally, his average icetime was only 16.0 minutes per game in 2011 (16th on the Devils) and 17.2 minutes in 2012 (12th). And much of that was on the power play. The Devils recognized that Clarkson wasn’t much more than a support player. Why didn’t the Leafs?
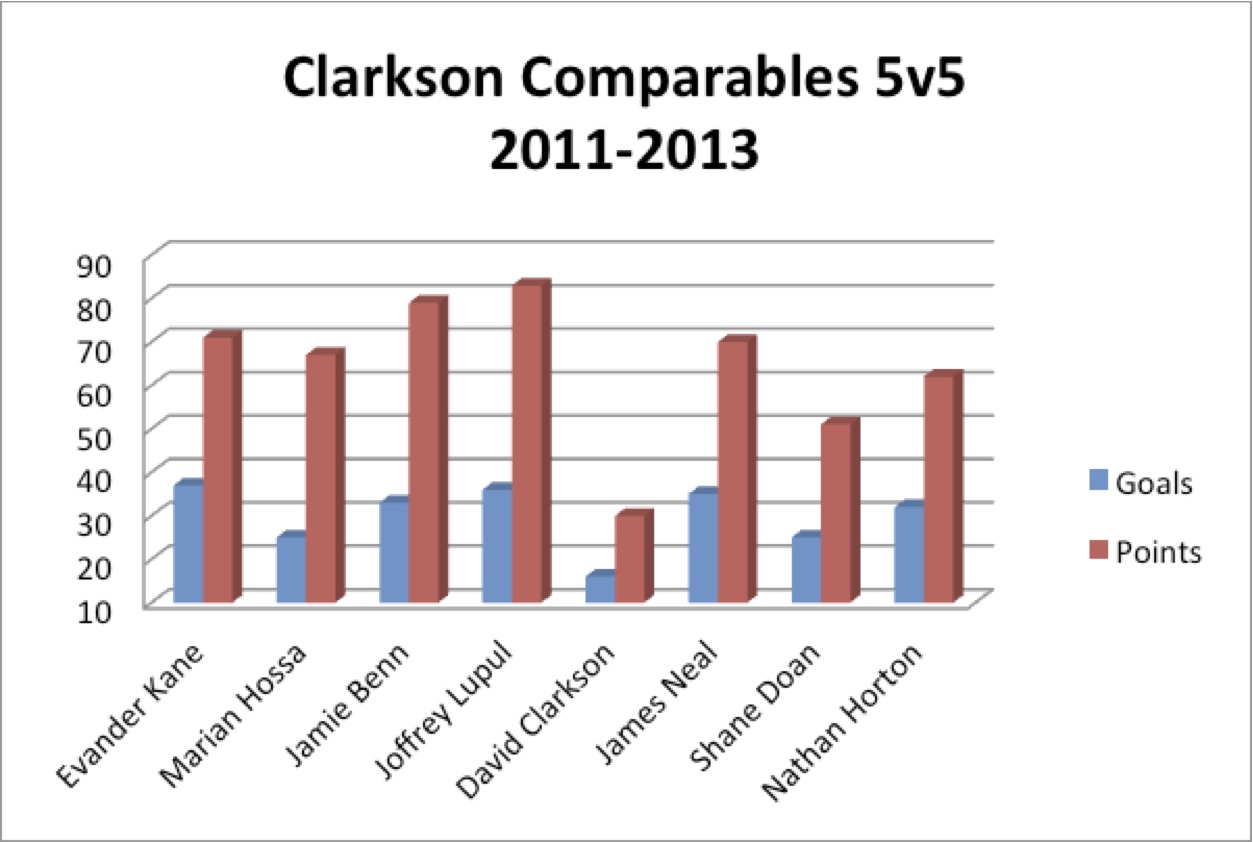
So that’s what Clarkson brought to the table. What’s it worth? One way to figure that out is to look at “comparables” – others in the league who earn similar amounts or deliver similar performance.
The chart illustrates the 2011-13 production of the other wingers in the league whose cap hit is between $5milllion and $5.5million (Clarkson’s is $5,250,000), currently on long-term deals expiring after 2015. (The numbers are normalized to account for the fact that several players missed a significant number of games).
Sometimes a picture is worth a thousand words. In this case, if Dave Nonis hadn’t been so dismissive of advanced stats, it would have been worth $36,750,000.
God, I'm not a Leafs fan, but this is just embarrassing. Nonis is such a dumbass, I hope his job security is highly scrutinized by the organization in light of Clarkson's performance and the forecasting that could have been done to avoid it, as you beautifully articulate here.
Loving the work you guys have done here, keep it up! Can't wait for the next article.