This week’s piece in The Star looked at the effect (if any) of a player’s size on his own performance and that of his teammates. Unfortunately, space constraints prevented us from going into as much detail as we would have liked. To that end, I would like to give a more thorough explanation of what we did. I have tried to write this up in a manner suitable for somebody not familiar with statistics, but who might be interested in learning a bit about statistical methods. Those with a statistical background may find my explanations a bit trite, but I hope you will find the analysis interesting. Those with no interest in stats may want to stop here; ahead lies nerdiness.
First, I should mention that a lot of this work was done by my colleague, Mikal Skuterud. Mikal is a first-rate economist with a rumoured mean streak on the ice. Oh, and like myself, he’s 6’4. So naturally, we are inclined to think that size correlates with general all-around awesomeness. You can imagine our disappointment.
As mentioned in The Star, the first thing we looked at was the correlation between player performance and size. We considered both height and weight as measures of size. We did have concerns about the data we had on weight as it remained the same for all years of observations we had for a player. One would think that if a player started his career at 19 and ended it at 35, for example, there would be some change in weight over that time, but it was not reflected in the data. As it is, we don’t know if the recorded weight was at the time of drafting, or the last season played. Height presumably could change as well, but shouldn’t be subject to the same fluctuations as weight. We’re pretty sure that Dustin Byfuglien doesn’t gain and then try to lose half a foot every offseason. That being said, if one player’s weight is listed as greater than another, chances are that the player listed as heavier weighed more for most, if not all, of his career. Just another example of data measurement issues, I suppose.
For this analysis, our data comprised all players who played at least 10 games in a season starting in the expansion era. Before expansion, the selection of players based on height and weight could be quite different as there were far fewer players in the league. At some point, it would be worthwhile to look at the entire history of the NHL.
When we looked at the data in aggregate, we saw no effect of size, so we began to break things down into distinct time periods. That’s when we noticed the effect in the early years. The following graph depicts the relationship between weight and points per game for forwards in the 4 eras (roughly corresponding to decades) we looked at.
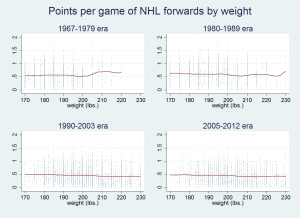 Note that these lines are not straight. A common thing you will see in data analysis, especially hockey analytics, is for people to calculate the correlation coefficient between two variables. This works fine if the relationship between those variables is linear, but not so well if not – in some cases it can be downright useless. So, in order to determine the nature of the relationship between size and performance, we estimated these lines non-parametrically. In a bit of an oversimplification, what this means is that we found the average performance for players of every listed height or weight, and then smoothed the resulting graph instead of just connecting the dots. The scale of the vertical axis is also much larger than the graph in The Star piece, and so it’s a little harder to see the magnitude of any effect, but easier to see an overall pattern.
The main takeaway from these graphs, in my opinion, is that the relationship between size and point production has changed over this time period. In the early expansion era (1967-1979), a lot of the best players were big guys – Phil Esposito, Charlie Simmer, Pete and Frank Mahovalich, Gordie Howe, Clark Gillies, were all at the upper end of the weight distribution. While there is a bump in in production at the top of the distribution in the 80s, the relationship is clearly not increasing from 1990 on. Interestingly enough, this spike in production for big players is evident in the 70s even though many (but not all) of the top Quebecois players were nowhere near the top of the weight distribution. Perhaps the Flying Frenchmen demonstrated that you didn’t have to be big to be elite.
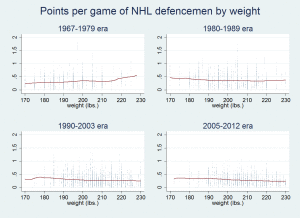
We also looked at the relationship between weight and points per game for defensemen. As with forwards, bigger defensemen scored more points in the early expansion era. After that, however, the relationship is decreasing.
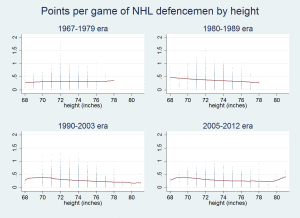
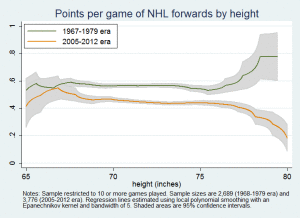 Looking at height, we found the same effect of eras, but a bit more subtle. Given the scale of the vertical axes in the graphs, the relationship between height and points can be seen easily for defensemen, but not so easy to see without changing the scale for forwards.
Note the uptick in production of defensemen at the very top end of the height distribution for defensemen in the post-lockout era. That increase is caused by the above average production of players who are 6’9”. Note, however, that there is only one 6’9” player in the post lockout era: Zdeno Chara. All those data points are him. If you’ve ever looked at Zdeno Chara and thought to yourself that you could also be a Norris Trophy winner if only you were built like him, you’re probably wrong. Chris McAllister was listed as just an inch shorter and 5 pounds lighter than Big Z, but was never confused for an All-Star. It’s not Chara’s size that makes him so good – he’s actually that talented.
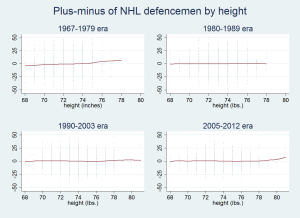 Of course, all this so far just looks at offensive production. It could be that the main benefit to size is defensive. To this end, we looked at pretty much the only stat we have going back that far that has any relation to defense: plus/minus. We only looked at defensemen. For weight, there was a slight positive relationship between size and plus/minus in the early expansion era as well as in the 80s, but quite flat since then. However, for height, we again saw a different relationship in the 60s and 70s. In the early expansion years, there was a clear benefit to being above 6’2”. Note that for every plus handed out, a corresponding minus is also given, so this increase in defensive production has to come at the expense of someone else. In the early expansion era, it was the players below 5’11” who were defensively deficient. In all other eras, players of all heights looked the same (which, of course, must mean an average of zero), with the sole exception of Chara, of course.
We wanted to see if perhaps it was the teammates of big players who benefited. Being a Leafs fan, I’ve heard far too many times about how Colton Orr “creates space” for his linemates. He was even put on a line with Nazem Kadri for a while, for this very reason. Given that size mattered for the early expansion era, one has to be careful when looking at correlations between team size and a player’s production. If big players tended to have big teammates, then you would find a positive relationship between a player’s production and the size of their teammates even if no relationship actually existed. You need to look for correlations between teammate size and productivity controlling for the player’s own size. This is done with multivariate regression analysis.
To do this, we looked for the simplest relationship between player performance and teammate size that took the player’s own size into account. That simplest relationship is linear, and can be represented by some form of the following equation:
PPG = a + b*player size + c*team size
The data are then used to estimate the values of a, b, and c that generate the line with the best fit for the era being examined. In the case of weight, the equations that best describe the effect of team weight are:
1967-1979
PPG = -1.1491 + 0.0008* player weight + 0.0084* team weight
1980-1989
PPG = 0.71 - 0.001* player weight + 0.0005* team weight
1990-2003
PPG = 0.7142 - 0.0016* player weight + 0.0003* team weight
2005-2012
PPG = 0.5938 - 0.002* player weight + 0.0013* team weight
Note that in all eras, the coefficient on team weight is positive. However, the estimate for the early expansion era is quite a bit larger than the others – more than 6 times the estimate for the post-lockout era and almost 17 times larger than the estimate for 1980-89. Moreover, the data points lie around this line, so it is a rough approximation. As such, the estimates of the values of a, b and c come with an estimated interval around them, which captures how accurate this approximation is. This is called a confidence interval. The confidence interval for the early expansion era does not include zero[i], and as such, we say that the estimate is statistically significant. Given how small the numbers are in the other eras, and the fact that their corresponding confidence intervals all include zero, we cannot be sure at any reasonable level of confidence that the true value is not zero.
The upshot of this is players did indeed seem to be more productive if they had larger teammates back in the early expansion era, but it doesn’t look like this is true anymore.
Finally, it is worth mentioning that these correlations cannot speak to the issue of whether being bigger causes a player or his teammates to be more productive. All a correlation tells us is how two variables move together in the data. There can be many reasons why two variables might move together that do not reflect a causal relationship between them. In particular, if GMs and scouts think that size is a stronger predictor of productivity than it actually is, then there will be a group of players who make it based on their size and not their skill, driving the average performance of bigger players down. Thus, it is possible to find no correlation between size and productivity even when a causal relationship does exist.
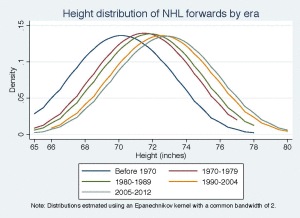 If this theory of discrimination is true, then we should see a disproportionate number of large players in the NHL. Looking at the distribution of height, we see that, in every era, the distribution of height among NHL players follows the typical bell-shaped distribution that we see in the population, only shifted up. Thus NHL players are disproportionately large, and getting larger over time.
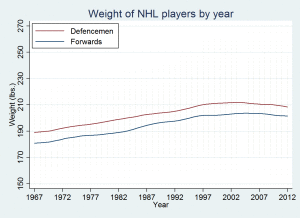
Looking at weight, we can also see how players are getting bigger over time.
So where does this leave us? For starters, if you’re a GM of an NHL team looking to sign a free agent or pull the trigger on a trade, there appears to be absolutely no reason to take a player’s size into consideration. Even if smaller, skilled players are being squeezed out of the league, the population of players you have to choose from in these two scenarios are those already in the league. And of those players already in the league, larger players are neither more productive themselves, nor is there any prima facie evidence that they are making their teammates better.
[i] For those who are interested, the 95% confidence interval for the coefficient on team weight is [0.0045, 0.0123] for the early expansion era. For 1980-89, the 95% confidence interval is [-0.0033, 0.0043]; for 1990-2003, it is [-0.0023, 0.0029]; and for 2005-2012, it is [-0.0021, 0.0047].

Do you guys ever feel kind of embarassed that the Star dubbed you the "Department of Hockey Analytics"? People who do real statistical analysis of NHL hockey like Tyler Dellow eat your lunch. Were you told to dumb it down for the benefit of Star readers, or was your analysis really just that superficial? Was there any consideration to the eras involved, given that scoring in the late 70's was almost two goals a game higher than it is now? Did you stop to think that the fact that the average height and weight being something like 2-3 inches taller and 10-15 pounds heavier now than they were in 1967 might've been important? Analysing how much a player is bigger/heavier than average rather than pure height/weight would've been a lot more instructive. How many guys actually played at 220 between 1967-1979 anyway? If it was more than 10 per season I'd be shocked; there are 118 listed as being on NHL rosters today. Ever hear of small sample sizes?
How can you just present this data without taking at least some stab at actually explaining it? There's a slight implication here that the number of talented players who were also big in 1979 might be more than today, given today's goon culture. How about actually expanding on that? I don't have a statistics background, and I don't find your explanations trite, but I think your overall analysis is poorly considered and of very little value. You guys have got a real platform here in the Star to actually bring advanced hockey stats to the masses, but stuff like this is a waste of time.